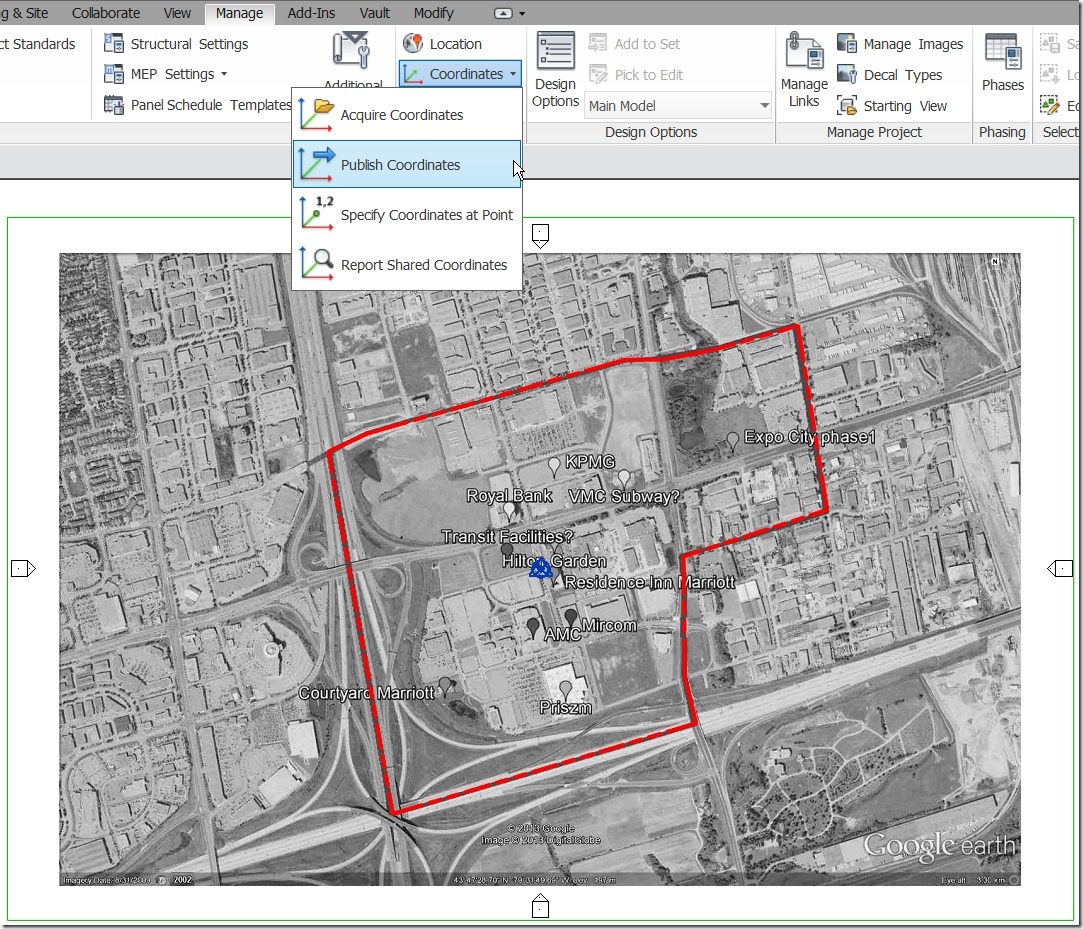
The proper workflow for a multiple building project would be to have each building as it’s own separate file which are then linked into a standalone site file. This is when we will take advantage of the publish & acquire coordinates function to set each files separate 0,0,0 to be co-ordinated with their actual locations relative to the site.
poor graphics performance in Navisworks
I found a great post the other day from Beyond Design that I thought I should share. This is from 2011 but if you are experiencing a sluggish Navisworks some of this may be helpful. Specifically the part I am interested in is below but the whole article is here.
The Model
Is it detailed? Is it large? How many triangles, you can find out under Project > Scene Statistics, compare this to what your card can handle? Models with lots of curves require more triangles, just get a piping model and switch to hidden line mode; you’ll see that this can build up quickly to create thousands and millions of triangles that need to be drawn. If you reduce the faceting factor (Options > File Readers), when bringing the native CAD file in, then this will reduce the number of triangles we use to draw the rounded item, lower it too much though and the item may look blocky, the default is set to 1.
Are there any parts of the model a long way away? Do a quick audit of the model by seeing if Zoom All zooms so far out you can’t see the model you expected. Use the Selection Box tool to work out what is distant from the model and see if you can change in the native application, if not then Hide it.
If you have set lots of the model to be required (i.e. prioritized when you are navigating) then you may experience lots of drop out of all the other items. Again, start from nothing (right click > Reset All > Unrequire All) and slowly build up adding those essential items.
Try running the model with ‘Scene Lights’ Lighting and ‘Shaded’ Mode on the Viewpoints tab, if this significantly improves performance then you might have over done it on the materials and lighting. Look at using the materials and lighting you need rather than going overboard and adding materials and lights to everything.
working with revit & navisworks
Collaborating with Navisworks can be a great way to communicate with all the project partners, it can also create some headaches. As collaboration gets more and more detailed each discipline needs to better understand the other disciplines and their working requirements. (This makes any employee who understands more than their isolated discipline a much more valuable asset!) One workflow is to have both Revit and Navisworks open and to co-ordinate geometry by exporting NWC files from Revit and updating the Navisworks model. In order to be effective and productive this has to be done as efficiently as possible, I am currently attempting this workflow only to be ground to a halt for 6-8 minutes every time I refresh my Navisworks file. Although to be honest it is giving me both the impetus and the time to write this entry ![]() So let’s go over a quick how-to for using Revit and Navisworks to help speed the process up.
So let’s go over a quick how-to for using Revit and Navisworks to help speed the process up.
What to Export
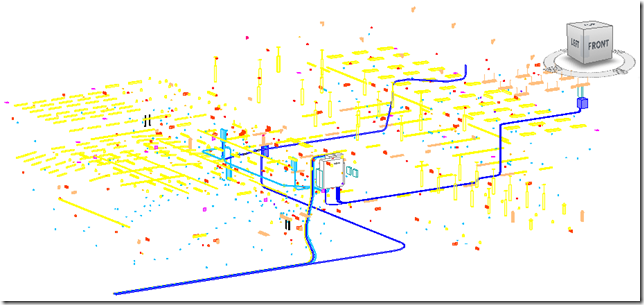
Always export only your own information! I can not emphasise this enough – everyone else is going to do the same so if you are the electrical there is no need for you to include the architectural model. As an example, the electrical model would look like this
So make an isolated 3D view (good practice is to name it “Navis” more on this another time) and go through the Visibility Graphics settings and turn off everything is not directly your own responsibility. There is a quick category caveat – family elements set to generic or speciality equipment may be from many different disciplines, think about editing them to make your families your own discipline or use VG filters to isolate your own.
HOW to Export
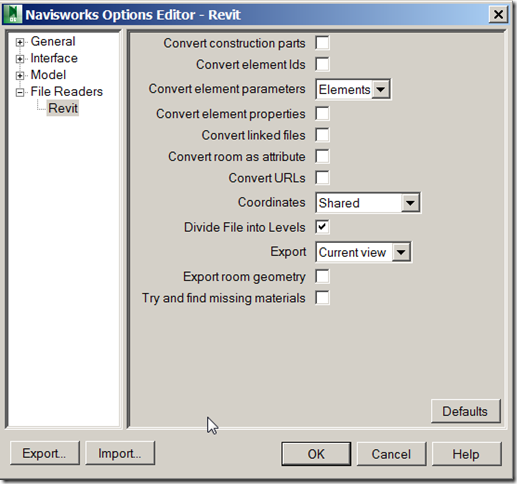
During the export to NWC there is a place to choose the Navisworks Settings…
My settings look like this
convert construction parts: unless you are the GC you likely don’t need to use this
convert element ID’s: this is the unique identifier for each element it could be left on
convert element parameters: Basic Revit properties will be included in the Navisworks file regardless of this setting. Checking this box will do 2 things during the export process:
1. Additional properties will be included with the resulting Navisworks file. These include properties for Navisworks related to the element properties, object orientation, material information, associated level, worksharing information, family specifications, cuttability and Revit object category.
2. Depending on the size and number of objects in your project, the export time can dramatically increase as additional properties will be translated. For example a 100 MB file with this unchecked may take a few minutes. Check the box and the export time may jump to 20 minutes. This is something to keep in mind if you don’t need the additional information in Navisworks. – PLEASE PLEASE UN-CHECK THIS
Checked
Unchecked
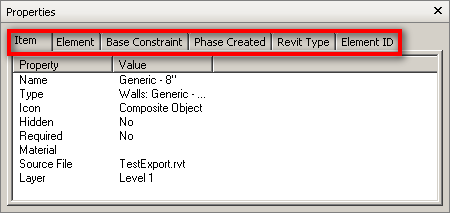
convert element properties : consider not including these (see above)
convert linked files: please don’t include
convert room as attribute: unless you are the architect this is not required
convert URLs: will include any URL’s associated with families
coordinates: this depends on the project specific settings
divide file into levels: helpful as it divides the selection browser to include levels but it’s not required if you don’t need it
export: current view: YES – this is why we made the “Navis” view – there is another reason to name it “Navis” but that is for another day
export room geometry: do you really need the room to be a transparent object in Navisworks getting in the way of EVERY attempt to select something? consider not checking this.
try to find missing materials: if they are missing here they are gonna be missing everywhere, who cares? if you couldn’t be bothered to find them and set up your Revit with them then they are obviously not important enough to be brought into Navisworks. besides we can add materials in NW and then render but again that’s for another day.
collaboration wormholes, distance is no longer an obstacle
2014 & the global village is a real. Distance is no longer an obstacle.
To ensure everyone is working toward a common goal, to save time and money, and to make business more efficient, modern society demands the ability to work together across distances. Instantly, easily and effectively, collaborating with colleagues in other locations as if you were in the same room drives social & business goals. We easily share personal moments, information, concepts and plans or discuss and brainstorm ideas together. Everyone participates regardless of their geographical location. The collaborative document is distributed instantly, ensuring that all participants have a record of the meeting’s outcome.
Autodesk Research has two collaboration rooms setup, one at their offices at One Market in San Francisco, Pier 9 and a mated one located in Toronto. Their intent is to create a “wormhole” between Toronto and San Francisco that will be “always on” during business hours. The idea is to have both locations work together on research projects. (see the article in It’s Alive in the Lab)
Revit Viewer
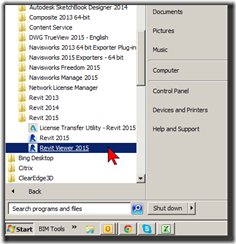
One way to get Revit into Viewer mode is simply to allow the 30 day trial to expire, however Revit does have a viewer (that does not of course use a license) and can be accessed from the Windows Start Menu:
The Viewer mode interface looks no different than the actual Revit interface as it is simply an unlicensed Revit that will allow a user to navigate the model and sheets as they like.
An important distinction about Viewer Mode is that it cannot be used to save (or save as) or to export in any way, it can however be used to print so long as nothing has been modified in any way. This ability to print can be helpful if the scenario arises that the Revit user is unavailable and Engineering needs to run the prints in their absence. (Again this is fine so long as Engineering does not make any changes, as soon as a change is made the print functionality is lost. In such an instance simply close the file – remember you can’t save – and re-open the same file and send it to print.)
Calculating BIM’s RoI
I saw this article from Cadalyst, take a read if your still not convinced that BIM is the right way to go…
With the advent of BIM (building information modeling), the building industry is coming to appreciate that technology can radically transform the building design and construction process. But before committing the funds to purchase that technology, the bean counters in an organization will probably insist on ROI (return on investment) analysis.
At that point, the folks tasked with producing the numbers usually grimace in pain and start twitching. But there’s an upside to ROI analysis. Although primarily used to justify a purchase, calculating ROI for a technology investment forces those involved to reach an agreement about why they are spending the money and what results they expect.
This month’s article delves into ROI for BIM solutions — which variables to consider, a sample formula and typical numbers, and a heads-up as to what the ROI metric overlooks.
ROI 101
ROI analysis is one of many ways to evaluate a proposed investment. It compares the gains anticipated from an investment against the cost of the investment.
Earnings/Cost = ROI
The ROI approach can evaluate many types of corporate investments, from R&D projects to training programs to fixed-asset purchases. The more complicated the investment, the more complicated the formula becomes. Just think about calculating the total cost of a departmental Microsoft Office upgrade versus calculating the total cost for a worldwide ERP implementation! And as the investments get larger, the creativity required to calculate the ROI becomes more significant, eventually entering the realm of black art.
ROI for BIM Investment
Mercifully, calculating the ROI for a design system can be relatively easy. The only hitch is that you need to consider the changes in user productivity during ramp-up. The diagram below (figure 1) illustrates what happens after you put a new system into place. There’s an immediate dip in productivity as users get up to speed on the new system. With time, productivity climbs back to where it was with the original system and levels off at a higher point as the new technology takes hold.

Figure 1. Visualize what happens when you put a new system into place.
A standard formula for calculating the first-year ROI is in figure 2. It uses just a few key variables related to system cost, training, and the overall productivity cost savings of a system. The next figure shows the formula variables (figure 3).

Figure 2. A standard formula for calculating first-year ROI.

Figure 3. The ROI formula variables.
The numerator represents the earnings portion of the equation, which comes from an increase in human productivity. The increase in average monthly productivity is represented in the left bracket (B – (B / 1 + E). The right bracket (12 – C) is the number of months in a year minus months in training (C). If the user needs three months to become as productive on the new system as on the old, then there are nine months left in the year to benefit from the productivity gains.
The denominator, which is the cost portion of the equation, includes the cost of the system (A) and the cost of the productivity lost, in terms of labor cost, as the user learns the system. This second term is the product of the monthly labor cost (B) multiplied by months in training time (C) multiplied by productivity lost in training (D) — therefore, BXCXD. Note that training time refers to the time it takes a user to reach the same level of productivity experienced on the original system — not the length of a training course.
Number Crunching
Now let’s plug some real numbers into this equation. The sample numbers used below are typical, but of course substitute your own estimates for an actual calculation.
A quick note about these numbers. Autodesk commissioned an online survey of its Revit users in December 2003. Approximately 100 users responded to the survey. I will use those results, compiled in the white paper, “Return on Investment with Autodesk Revit,” as the basis for the sample numbers below (figure 3). The white paper also includes an Excel-based ROI calculator for BIM that you can use for your own ROI calculations.

Figure 4. A sample ROI calculation.
Using these numbers, ROI is slightly more than 60%! That’s a healthy ROI for most IT investments. But every company must decide what’s an acceptable return on their investment. Small companies might need to demonstrate how they plan to repay a bank loan. Larger companies may use ROI to compare proposed uses of their working capital.
Critical Variables
If you play around with the numbers, you’ll notice that the productivity gain and loss are the most sensitive variables in the equation. Slight changes in those figures produce the most dramatic changes in ROI. You can understand why productivity is so critical: It’s the long-term result of an IT investment.
The productivity gain figure used in our sample calculation (25%) is indicative of results reported to Autodesk and a conservative estimate. One Revit customer, Rhode Island-based Donald Powers Architects, recently measured the productivity gains the firm experienced using Revit for numerous design projects (figures 4 and 5). Principal Donald Powers reports, “With about 20 projects completed in Revit, the firm has seen productivity gains of 30% in design and documentation, and a 50% drop in requests for information during construction.” In addition, training time — the time it took the staff to become as productive on the new system as the old — was just 14 days vs. the three months used in our sample formula.

Figure 5. Donald Powers Architects completed approximately 20 design projects using Autodesk Revit, including this innercity rehabilitation project.

Figure 6. Donald Powers Architects found that using Revit has resulted in a 30% productivity gain — a key variable used for ROI calculations — for projects including this high-end residential development.
In Autodesk’s recent online survey, more than half the respondents experienced productivity gains of more than 50% using the Revit building information modeling solution, and 17% experienced productivity gains of more than 100%.
The least important factor in our ROI calculation turns out to be the system cost, an interesting fact to remember the next time you’re involved in a technology purchase. Doubling the system cost in the original set of numbers (from $6,000 to $12,000) reduces the ROI by only 20% (from 61% to 41%).
ROI Limitations
ROI is a popular metric, for sure. It boils down a complex soup of numbers into a single percentage everyone can digest. But beware: The ROI metric is more accurate for cost-saving projects than for revenue-generating projects. ROI analysis works best for IT implementations that produce tangible, easy-to-measure cost benefits, such as improved productivity.
When calculating ROI in terms of revenue generation, analysts often use estimates — lessening the accuracy of the results. A more extensive ROI on the adoption of BIM could include profit gains from increased billing, project quality, and increased repeat business; improved communication and client presentations; links to external analysis applications; and so on. The difficulty is in projecting the value of those gains.
For example, one respondent to the Revit survey stated that adopting BIM had shifted the time split between traditional design and documentation. Using Revit decreased the hours the firm spent on producing construction documents by 10%, allowing users to spend that extra time in more constructive, up-front design work. As a result, the firm was reevaluating its fee structures. This profitability boost may be complicated to calculate, but you could certainly factor it into a more complex ROI analysis.
Likewise, another survey respondent (a 300-person architectural firm) reported that it completed several projects using Revit with half the budgeted staff and in half the budgeted time. It would be easy to factor in the reduction in budgeted time — a direct component of productivity — but the ramifications of the excess design staff is a bit more complicated and more difficult to quantify.
ROI: Final Thoughts
If you’re asked to help determine the ROI for building information modeling, don’t go into a tailspin. Adopt the viewpoint that it’s a necessary evil and turn it into a useful learning experience for yourself and your organization, providing crucial insight for future projects. And once the ROI is complete and the technology is in place, don’t forget to measure your organization’s actual performance against the expectations.
– See more at: http://www.cadalyst.com/aec/calculating-bim039s-return-investment-2858#sthash.eBcYyxzY.dpuf
DWF is Dead??
After much concern for the DWF format and after bringing it up many times I had a colleague point me to the Autodesk Labs blog about the DWF file format. Here is a little summary
Scott Sheppard said in reply to Anthony Mason…
Just so you don’t have to read between the lines.
1. Autodesk Design Review 2013 is frozen. It is still available for download for free, supports DWF files generated by the 2015 products, but no active development is happening on it.
2. DWF is not dead. The file format forms the basis for things like Autodesk Vault as well as some things we want to do that are cloud-based.
3. AutOCAD 2015 didn’t really have much change for PDF support. That wasn’t a theme for the 2015 release. DWF and PDF are artifacts from teh real design data (e.g. DWG). We want to eliminate artifacts where we can. The counter argument to this is that artifacts are a subset of the real design data whose content can be chosen by the customer.
4. Where our focus is could be called cloud/mobile/social. Cloud in that infinite computing can be applied to analysis and simulation. Mobile in that people want to access design data from a wide variety of devices like desktops, laptops, Macs, iPhones, Androids, etc. Social in that projects shoudl place people at the center and serve up the data to them.
So when people say “I don’t like Autodesk 360, will you port Autodesk Design review to the Mac?”, the answer is no. Rather than do that, we would spend our resources updating Autodesk 360 so that native design files can be viewed on a Mac via Autodesk 360. This could involve dynamically converting the data to DWF, HTML5, SVF, or whatever is suitable on demand and using modern programming approaches to deliver the user experience. The user experience of looking at design data should be part of a larger project experience where users share project status, text messages, video chats, and all of the other stuff that goes on during a design project. A design project should be more like social media than an individual tool for looking at one DWF file on one specified platform. Autodesk 360 will one day grow up to be that solution. Until it grows up, we have desktop applications bundled into suites that customers can continue to use….
 Anthony Mason said in reply to Scott Sheppard…
I can hear someone saying, “Architectural Desktop and Volo View Express work correctly today. You are free to stick with those versions until the end of time.”
Please don’t take this personally, Scott. I think a lot of us are just really disappointed. Also, whether it’s justified or not, it’s not common for someone to be happy to need to now pay for what they’ve been getting for free for years.
For me, I’ll be actively researching other options. Even if dwf isn’t dead, Autodesk Design Review is dead, and there’s no point planning to keep it around long term. Maybe some other options, like Tekla BIMsight or Bluebeam Revu will pan out…
Scott Sheppard said in reply to Anthony Mason…
On that we agree. Design Review is not for the long term. Only keep it until Autodesk 360 is equivalent or better. By the way I routinely answer questions from people who still use Volo View and even WHIP!
Sent from Scott’s iPhone
The bottom line, the DWF file format is not dead as Autodesk is using it for things like Vault and Autodesk360. On the other hand, although not dead yet, Design Review has a DNR (Do Not Resuscitate) order and will be allowed to quietly die once Autodesk 360 is equivalent or better.
2d Quantity Takeoff Navisworks
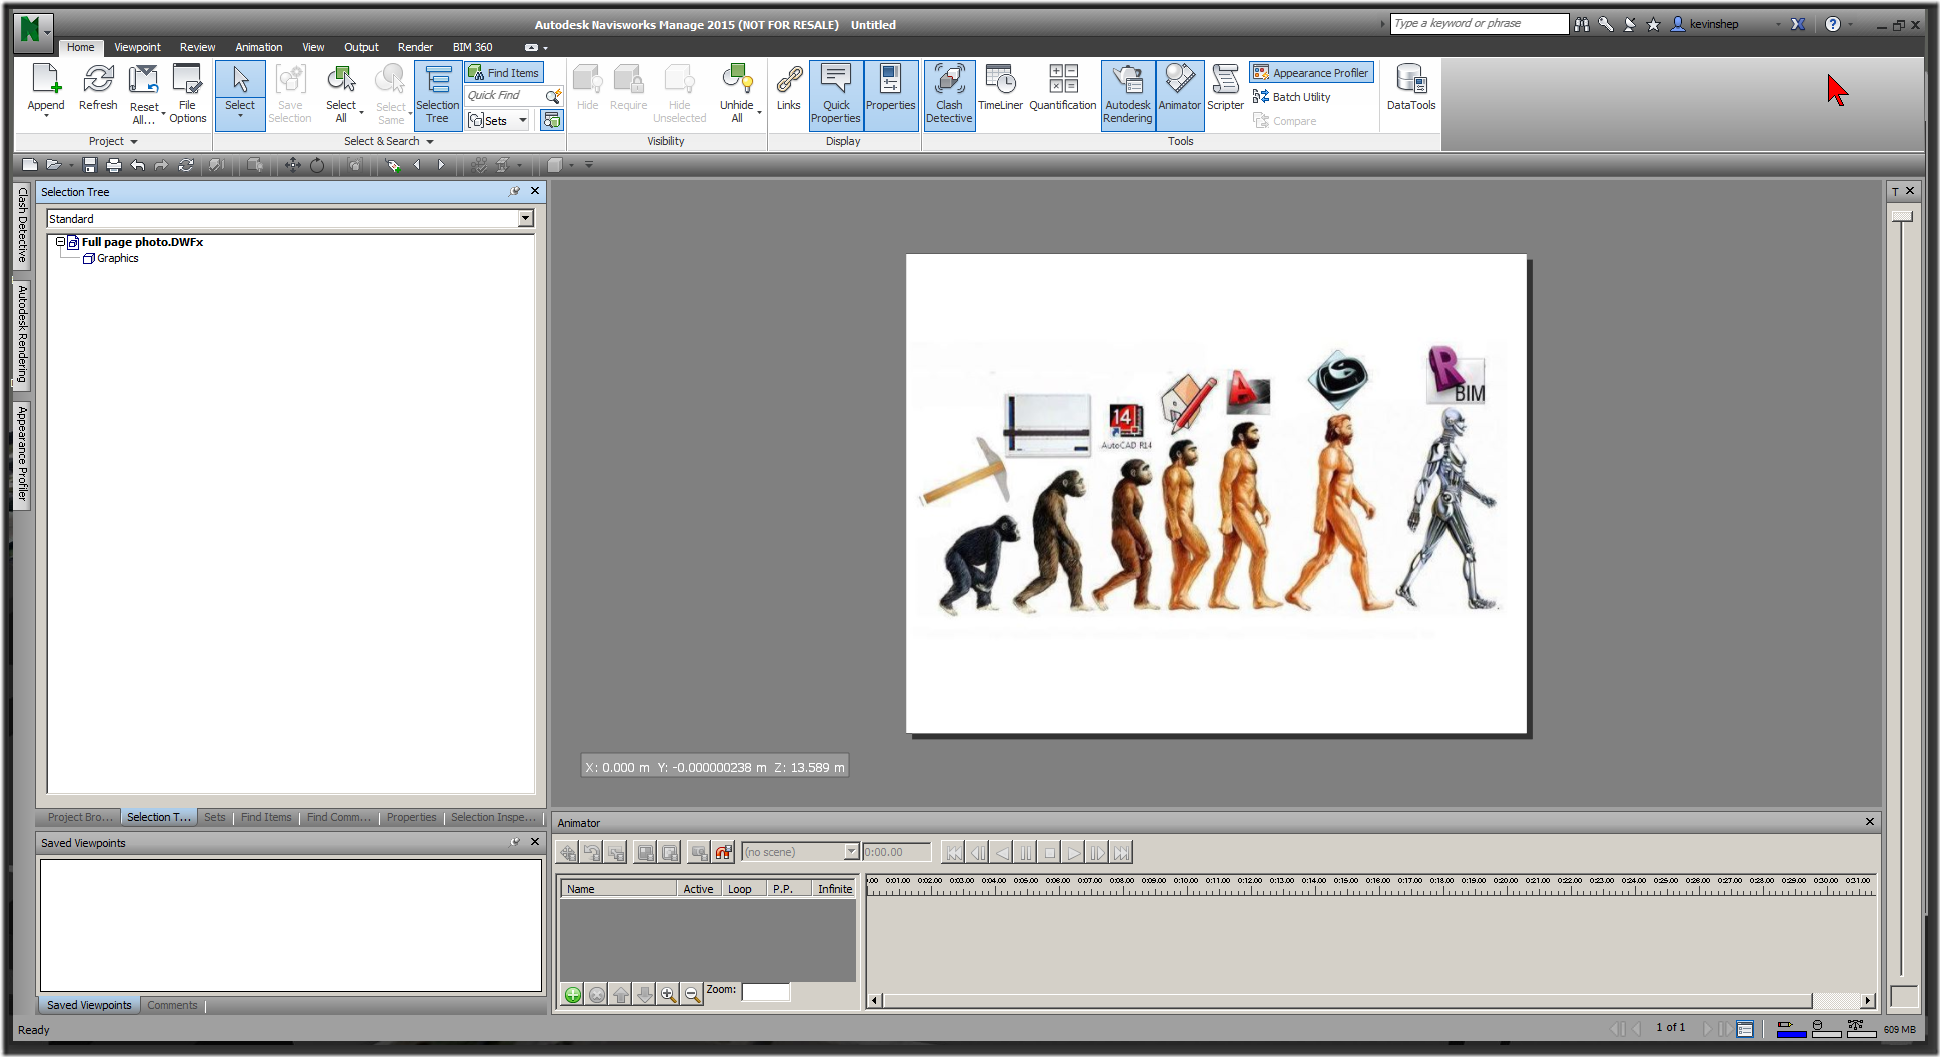
Navisworks 2015 now supports 2d takeoff’s from image files!
Sort of. Wait, what?
While it would be great to import .JPG or better yet .PDF files right into Navisworks that is just not possible. Hang on, I thought you just said 2D image files? That’s right I did (because that’s what Autodesk said) BUT the only 2D file that is importable is the .DWFX format. Ahhh – design review might not be dead after all!
Ok so I can get the designer to export their BIM file sheets to .DWF, no problem right. Right, again sort of. Just be careful importing the 2D sheets in from a .DWF as you will also get the 3D geometry, which is ok but I already have that from the .RVT file I appended so a quick hide will remove the excess 3D information. (This annoyed me at first but after a little thought I realized that the exporting program might not be available and so having the 3D available in the .DWF is probably a good thing.)
Hang on, my designer only wants to give out .PDF files ![]()
No worries they have probably made those .PDF’s using a proxy print driver from the cad application right? Well we can simply re-print the .PDF through a proxy .DWF print driver that you can get here.
This is not limited to .PDF files, oh no! Anything you can send to a printer an be sent to the .DWF printer instead, as a sample I give you a quick sample not of evolution but of BIMolution 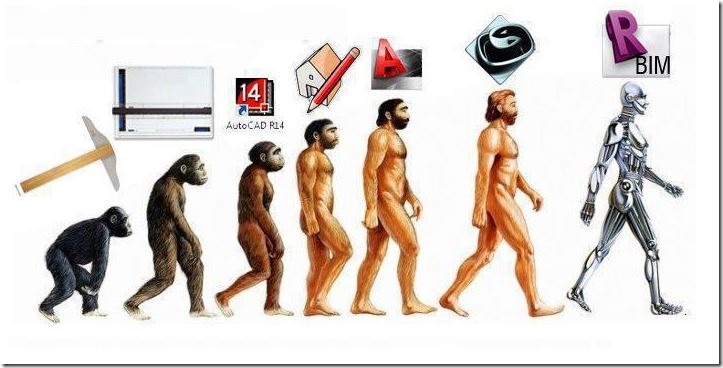
let’s play “Render Or Real”
The boundaries between photographs and digital renderings are blurred. See if you can guess which of these images are rendering or reality!
1. Innie & Outie House
Innie & Outie are two different types of courtyard houses. Three of each type, totaling six houses, are sited close to Dianshan Lake—a large freshwater lake in Qingpu, Shanghai, China. |
2. HendeeBorg House
The HendeeBorg House in Sonoma, CA is a symmetrical saw-tooth roof house for two artists – a sculptor and a media artist – that includes a pair of large artist studios, a gallery space, and a sequence of domestic spaces. |
3. House Hafner
The House Hafner is located in the countryside next to a forest in Southern Germany. This secluded home is surrounded by stunning views of the forested landscape. |
4. Engel Residence
This house in Scottsdale, AZ doubles as the Engel’s office and design studio, and includes a gallery and art studio that wraps around a large existing mesquite tree. |
5. Allandale House
The Allandale House is an A-frame home that utilizes the acutely angled corners meeting the floor as opportunities for built-in storage and thickened walls. |
6. The Umubano Primary School
This school, designed by MASS Design Group, has unique settings for learning with a mix of interior rooms, exterior teaching areas, and terraced play spaces for children. |
7. Tind by Claesson Koivisto Rune
Tind house was created by designer Claesson Koivisto Rune. Each house features a roof with a gentle incline to match the housing vernacular in Sweden. The peak of the roof is flat, which the designers compare to the profiles of the Scandinavian Mountains. |
8. Butaro Hospital
This hospital, designed by MASS Design Group and located in the rural Burera district of Rwanda, has an innovative design that maximizes airflow to prevent the spread of airborne diseases. |
9. House in Suffolk
Designed by Strom Architects, this private house in Suffolk, UK is a country home that is set among the ruins of an old home that burned down eight years ago. The building is entered via a bridge that spans through the ruins. |
Learn more about the architectural visualization artist who created the renderings: Peter Guthrie.
Learn more about Autodesk’s capabilities for Architecture, Engineering and Construction.
Answers:
1) Rendering
2) Rendering
3) Rendering
4) Real
5) Rendering
6) Real
7) Rendering
8) Real
9) Rendering
An Updated look at LoD
As BIM authors become more adept it quickly becomes apparent that a more hybrid understanding of 3D graphics is required. This new level of modeling takes the technical drafter down the road closer toward a visualization or animator role. Therefore a more specific description of Level of Detail/Development is required. (Each RPF or BIM Implementation needs to have a section defining LoD as it’s specifics mean different things to different people.)
It it important to note that Level of Detail and Level of Development are different things… Level of Development outlines what a model is authorized to be used for while Level of Detail describes the model’s graphical properties and goes together with Level of Appearance Quality (LoAQ).
Level of Detail in General
LoD1: Buildings are represented by their footprint or the roof outline with a constant height value. Inclusion of some density data or distances are possible.
LoD2: Buildings are represented by massing models.
LoD3: Buildings are represented by geometrically simplified exterior shell. Analysis of the materials is possible leading to an estimated ‘R’ value of the wall assembly & energy conservation performance.
LoD4: Buildings are represented by geometrically exact exterior shells.
LoD5: Building interiors are included.
Geometric Level of Detail (GLoD)
GLoD1: Buildings are represented as 2D surfaces inserted into 3D space.
GLoD2: Buildings are represented as simple 3D geometry.
GLoD3: Buildings elements that are 15cm and larger are included.
GLoD4: Buildings elements that are 5cm and larger are included.
GLoD5: Buildings elements that are 1cm and larger are included.
Level of Appearance Quality (LoAQ)
LoAQ0: No minimum appearance quality is specified.
LoAQ2: Buildings are represented as “shaded with edges” and indicates true colour. Includes shadows
LoAQ3: Building on the requirements of LoAQ2 but is expanded to include material mapping.
LoAQ4: Building on the requirements of LoAQ3 but is expanded to include full texture mapping (bump maps, transparency, luminance, reflectance…) to produce a photo real environment.

